In a recent article about my experience with certain social media platforms, I mentioned that a lot of the discussion on X (formerly known as Twitter) revolves around politics and culture. Ever since takeover by new management and subsequent rebranding, even a cursory glance through trending topics on this platform reveals a great deal of anxiety among certain demographics with regards to race and gender. Many people on that platform are blaming diversity, equity, and inclusion (DEI) policies for having to endure personal hardships in an uncertain economy.
Sifting through this discourse makes it clear that visible minorities and women are being blamed not only for taking away jobs from what are considered to be ‘deserving candidates’ but also for a deterioration in quality of corporate (and bizarrely, civilizational) output. Immigration appears to be of great concern among a section of people of European descent that calls North America home. Economic and racial anxiety among these demographics has led to hysterical claims about ‘the end of Western Civilization’. This fear and anxiety is certainly being expressed more strongly as election season heats up in North America.
This article is unconcerned with the benefits or drawbacks of immigration and it is similarly disinterested in allaying the fears of a demographic that finds itself downwardly mobile. Disgruntled malcontents among the latter are exhibiting a craven aversion to personal responsibility by taking out their ire on visible minorities that are simply trying to build a better life for themselves. Meanwhile policy makers are seemingly content letting visible minorities in general and immigrants in particular bear the brunt of backlash to their policies.
Objectives
Now, amid a vitiated atmosphere such as this, is an apt time to examine how DEI policies are actually being implemented in the corporate world. Many companies have championed their DEI initiatives and have been vocal about their commitments to diversity across all levels of their organizations. Actions, however, speak louder than words. It is worth examining data to observe just how diverse their workforce is and whether this diversity is also reflected in their leadership.
It is important to measure diversity in leadership, relative to diversity in the overall workforce. It tells us how serious a company is about diversity as a value proposition. It tells us whether diverse employees are being given the necessary support, training, and resources to advance in their careers. It also tells us whether a company is hiring diverse employees only to be managed by a non-diverse management team. It tells us whether companies are taking advantage of vulnerable employees without having any intention of truly making them a part of the company’s success stories.
To this end, this article examines the proportional representation of visible minorities and women in leadership across some of the top companies in the telecom and banking sectors of Canada, relative to their representation in the overall workforce of these companies.
Why Canada
A great deal of the incendiary rhetoric around race and gender emanates from Canada and this tension has become mainstreamed in political discourse over the past few years. Canadian companies prove to be excellent case study specimens for studying corporate trends because competitors in any given sector seem to operate very similarly to each other.
Why Telecom and Banking
The top companies in Canada in these two sectors are some of the largest in the country, both in revenue and in employee count. Many of them have long, and vocally, championed diversity in the workplace. They are also publicly traded companies. This obliges them to report their performance to their shareholders and the general public. It provides a wealth of information about their performance in different metrics, especially with respect to DEI. Their stature as industry leaders and as publicly traded companies makes their actions set an example for other companies to follow and learn from.
Methodology
The companies being studied in this article are: Bell, Rogers, Telus, TD Bank, Royal Bank of Canada (RBC), and Bank of Montreal (BMO). Each of these companies’ annual, ESG, and sustainability reports for 2023 were studied. The data presented in this article is taken from these reports. All referenced reports are listed at the end of this article.
This article is concerned with measuring the proportional representation of visible minorities and women. Visible minorities is a term that generally includes indigenous peoples, non-white peoples, and black people. BIPOC (Black, Indigenous, People of Color) is another term that is commonly used in place of visible minorities.
Many of these companies also operate outside Canada but the data presented here is only of their Canadian operations. Each company records and reports data differently and thus they may not be immediately comparable. Nevertheless, every effort has been made to present them as uniformly as possible.
Telecom
Bell
The Figures
Bell reported that, in 2023 and as shown in Figure 1, visible minorities constituted 31.10% of its overall workforce whereas women accounted for 32%. 35.30% of the company’s management were visible minorities whereas 38.10% were women.
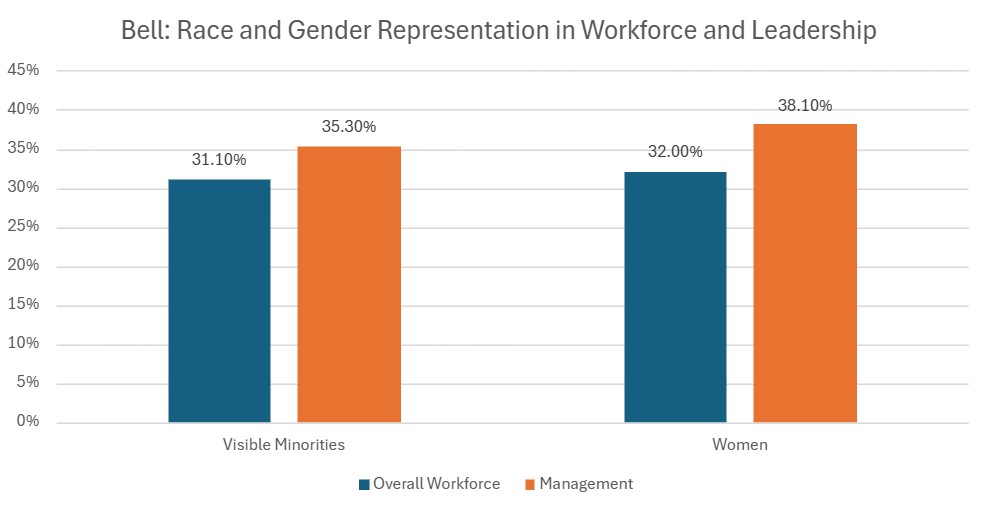
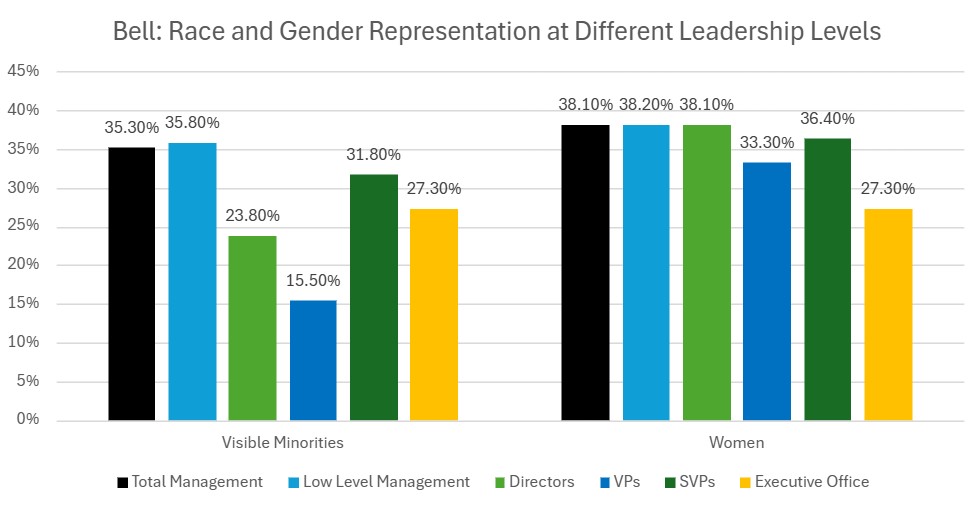
Figure 2 shows the representation of visible minorities and women across different levels of management.
Observations
While both visible minorities and women have a higher representation in leadership relative to their total representation in the workforce, women have a slight edge in this over representation.
In addition, visible minorities have an uneven representation across different leadership levels, particularly at the Director and VP level where they are under represented.
Rogers
The Figures
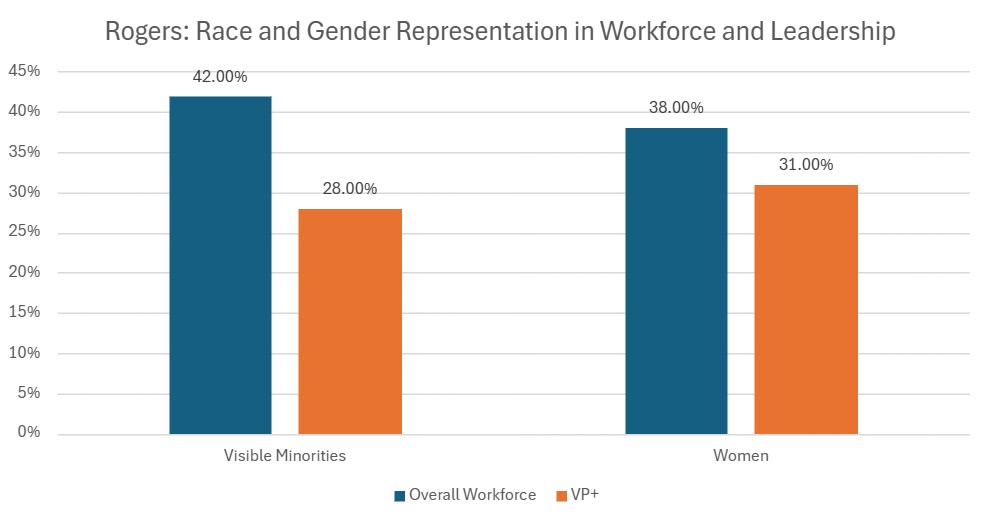
Rogers reported that, in 2023 and as shown in Figure 3, visible minorities constituted 42% of its total workforce whereas women constituted 38%. 28% of management at the VP+ level were visible minorities while 31% were women.
Observations
It is noteworthy that representation at the VP+ level for both visible minorities and women were lower relative to their proportions of the total workforce. However, visible minorities had a lower representation at that level than women despite having the greater workforce proportion.
Telus
The Figures
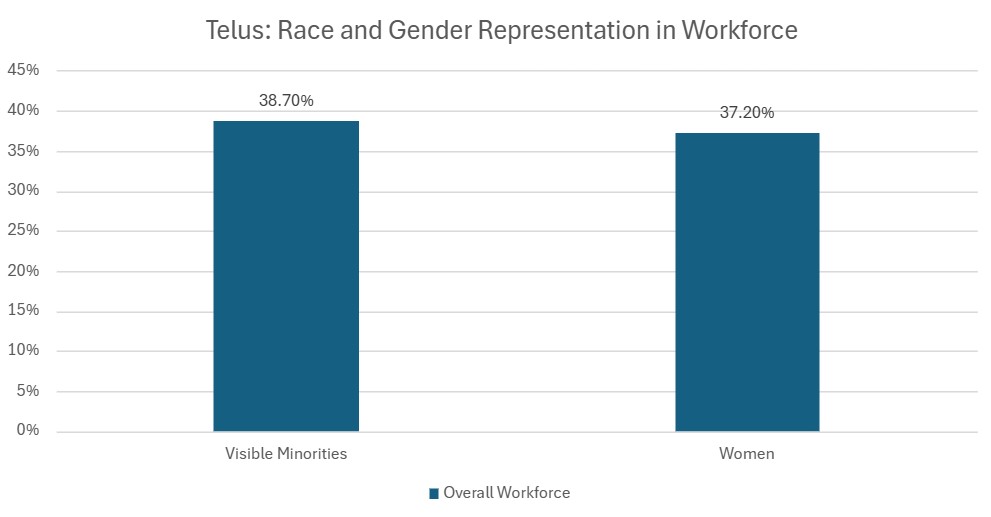
Telus reported that, in 2023 and as shown in Figure 4, visible minorities constituted 38.70% of its workforce whereas women constituted 37.20%.
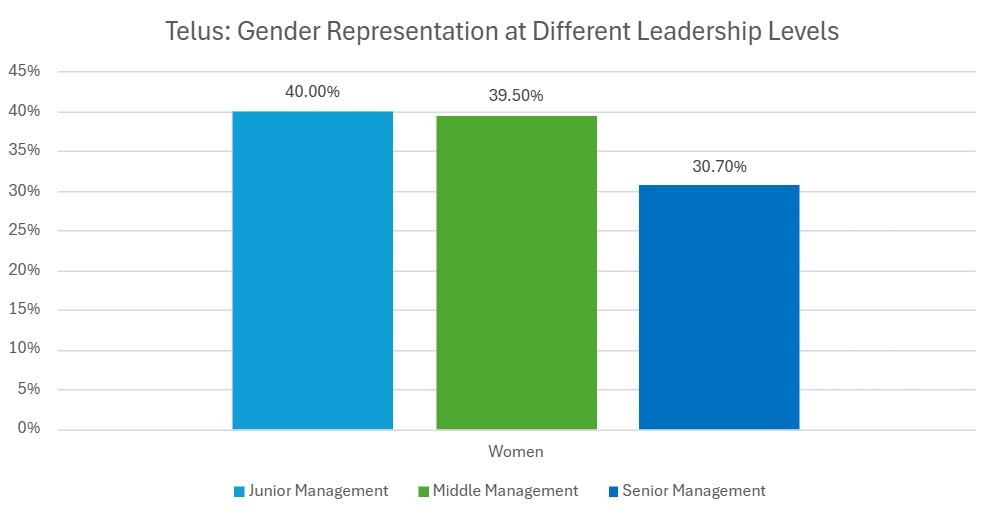
Telus does not seem to have reported the total proportion of visible minorities at the leadership level. However, they have reported the proportion of women at different levels of leadership as shown in Figure 5.
Observations
It is noteworthy that Telus has not reported on the representation of visible minorities in their leadership. It is comparatively keen on measuring and reporting the representation of women in leadership positions. Women appear to be over represented at the junior and middle management roles while being under represented at senior management levels.
Banking
TD
The Figures
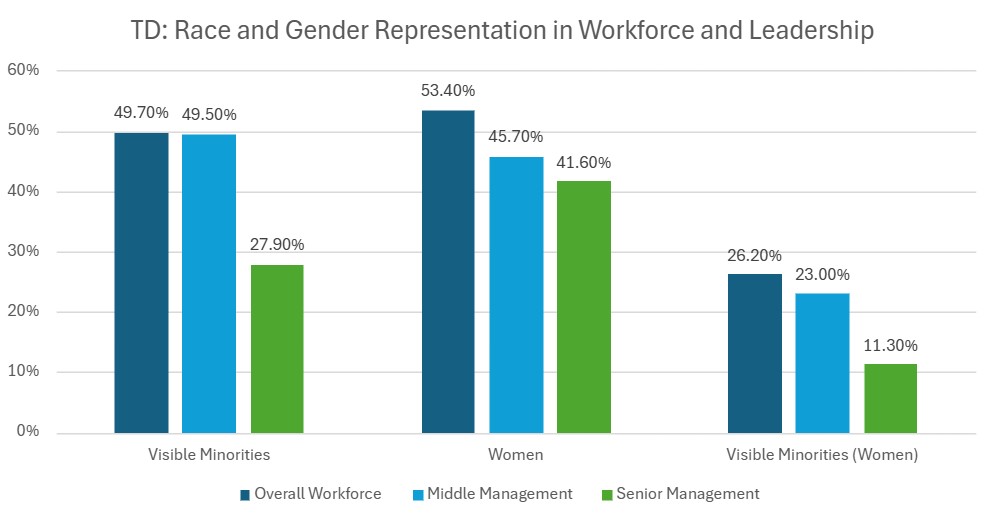
TD has reported the proportional representation of visible minorities, women, and visible minorities (women) across their overall workforce and two management levels as shown in Figure 6. The recording and reporting of the proportion of women visible minorities is welcome as it provides a more granular view of race and gender diversity across their organization.
Visible minorities constitute 49.70% of TD’s workforce in Canada whereas women constitute 53.40%. Women visible minorities constitute 26.20% of the overall workforce and hence constitute slightly more than half of the total visible minority workforce. The proportion of visible minorities among women is similar to the the proportion of visible minorities across the overall workforce.
Observations
While both visible minorities and women are generally under represented across management relative to their overall workforce proportions, it appears that the under representation is far greater for visible minorities in general and women visible minorities in particular, especially at the senior management level.
Women constitute 41.60% of senior management while constituting 53.40% of the total workforce. Visible minorities constitute 27.90% of senior management while constituting 49.70% of the total workforce. Women visible minorities constitute 11.30% of senior management while constituting 26.20% of the total workforce.
40.50% of visible minorities at the senior management level are women which is close to the 41.60% figure of women representation at this level. Also, 27.16% of women at this level are visible minorities which is close to the 27.90% figure of visible minority representation at this level.
It appears that representation of visible minorities (men and women) at the senior management level lags far behind that of women relative to their respective proportions of the overall workforce.
RBC
The Figures
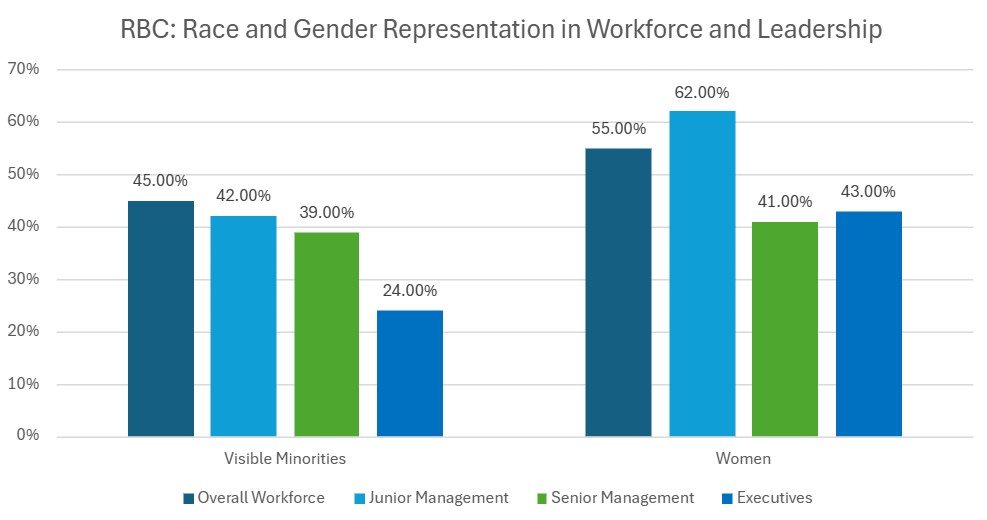
RBC reported that, in 2023 and as shown in Figure 7, visible minorities constituted 45% of the overall workforce in Canada whereas women constituted 55%. The representation of these two demographics at 3 different levels of management are also shown in Figure 7.
Observations
An under representation of visible minorities in management positions relative to their workforce participation can be observed here and it is more pronounced at the executive level. Women, however, are over represented at the junior management level but generally under represented at senior and higher levels of management.
BMO
The Figures
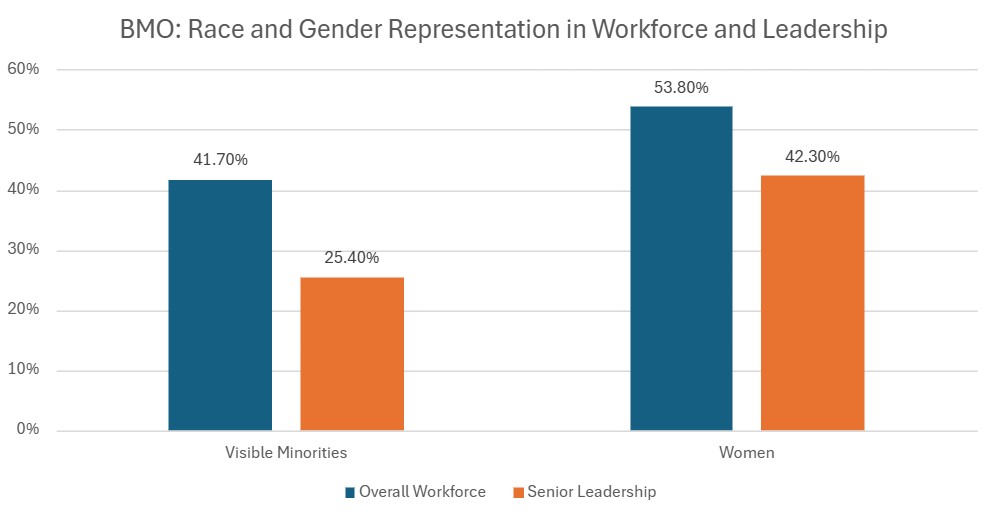
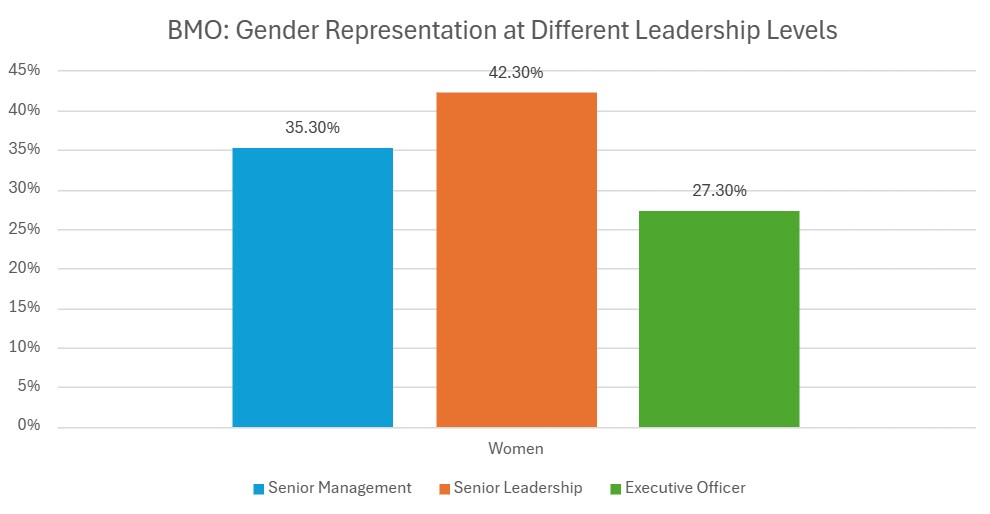
BMO reported that, in 2023 and as shown in Figure 8, visible minorities constituted 41.70% of its workforce and women constituted 53.80%. Visible minorities accounted for 25.40% of its senior leadership while women accounted for 42.30%.
BMO records and reports proportion of women at other levels of management, as shown in Figure 9, but does not appear to do the same for visible minorities.
Observations
Both visible minorities and women were under represented at the senior leadership level relative to their proportions of the workforce, although the under representation of visible minorities was greater. Women also appear to be under represented at the senior management and executive levels, however, comparable data for visible minorities is unavailable.
Analysis
Clearly, all of these companies recognize the importance of diversity not only in their workforce but also in leadership. They’ve put in the processes to measure and report on these metrics in their annual reports to shareholders and the general public. Some companies provide more granular data whereas some provide high level overviews. Perhaps the degree to which they measure shows their commitment to their stated goals.
A study of the proportion of visible minorities and women in leadership positions relative to their workforce participation across these companies shows that while both demographics are under represented, visible minorities are generally under represented to a far greater extent. Thus, while both gender and racial diversity in leadership appears to be a desired goal across these companies, the commitment to gender diversity seems to be stronger.
Although it is beyond the scope of this article, it is worth wondering why representation of visible minorities is lagging in leadership.
- Is sufficient support, training, and resources being provided to them to succeed in their careers? If these companies want to be seen as places where individuals can build careers, surely they would want to develop people to progress to leadership. However, building leaders is an investment that pays off over the long term. A lack of representation of a demographic in leadership relative to their overall workforce participation may indicate insufficient investment in their development.
- Immigrants in Canada are often told that it is necessary to have “Canadian experience” in their resumes, with the implication being that their experience in their home (or other) countries doesn’t really count. Is this handicapping their career advancement? From what I have seen, there is nothing special about experience gained in Canada that would make experience gained outside it irrelevant. Certainly not in an increasingly globalized world. Perpetuating this myth will only invite accusations of using it as a justification to deny immigrant employees their rightful due.
- Is there an unequal commitment to diversity when it comes to representation of women and visible minorities? Is it easier, or preferable, for these companies to claim championing diversity by focusing more on gender diversity than on racial diversity? These are sensitive topics but actions do speak louder than words. While these companies have admittedly done impressive work in furthering diversity across different levels of their organization, clearly, there is room for further improvement.
Conclusion
This article examined data on diversity in leadership teams across top companies in Canada’s telecom and banking sectors relative to the diversity in their overall workforce. There seem to be obvious efforts to making leadership teams more diverse, however, visible minorities and women still tend to be under represented. Furthermore, visible minorities seem to be far more under represented in leadership teams when compared to women. It is evident that there is room for improvement and one expects these companies to continue to strive to do better. If even the top employers in Canada are struggling to truly and equitably represent visible minorities and women in their leadership teams, then it is quite likely that the situation is worse in smaller, and private, companies.
References
Bell. (n.d). 2023 BCE Integrated Annual Report. Accessed on 13 September 2024.
Bell. (n.d). 2023 Corporate responsibility ESG initiatives summary. Accessed on 13 September 2024.
Rogers. (n.d.). 2023 Annual Report. Accessed on 13 September 2024.
Rogers. (n.d.). 2023 Data Supplement. Accessed on 13 September 2024.
Telus. (n.d.). 2023 Annual Report. Accessed on 13 September 2024.
Telus. (n.d.). Telus 2023 ESG Data Sheet. Accessed on 13 September 2024.
TD. (n.d.). 2023 Sustainability Report. Accessed on 13 September 2024.
TD. (n.d.). 2023 Sustainability Performance Data. Accessed on 13 September 2024.
BMO. (n.d.). 2023 Sustainability Report Data Pack and Glossary. Accessed on 13 September 2024.
Note: If you notice any inaccuracies in the data presented in this article or if you would like to request any corrections, please contact me.

